Maps, Big Data and pictures – how to make the City flow
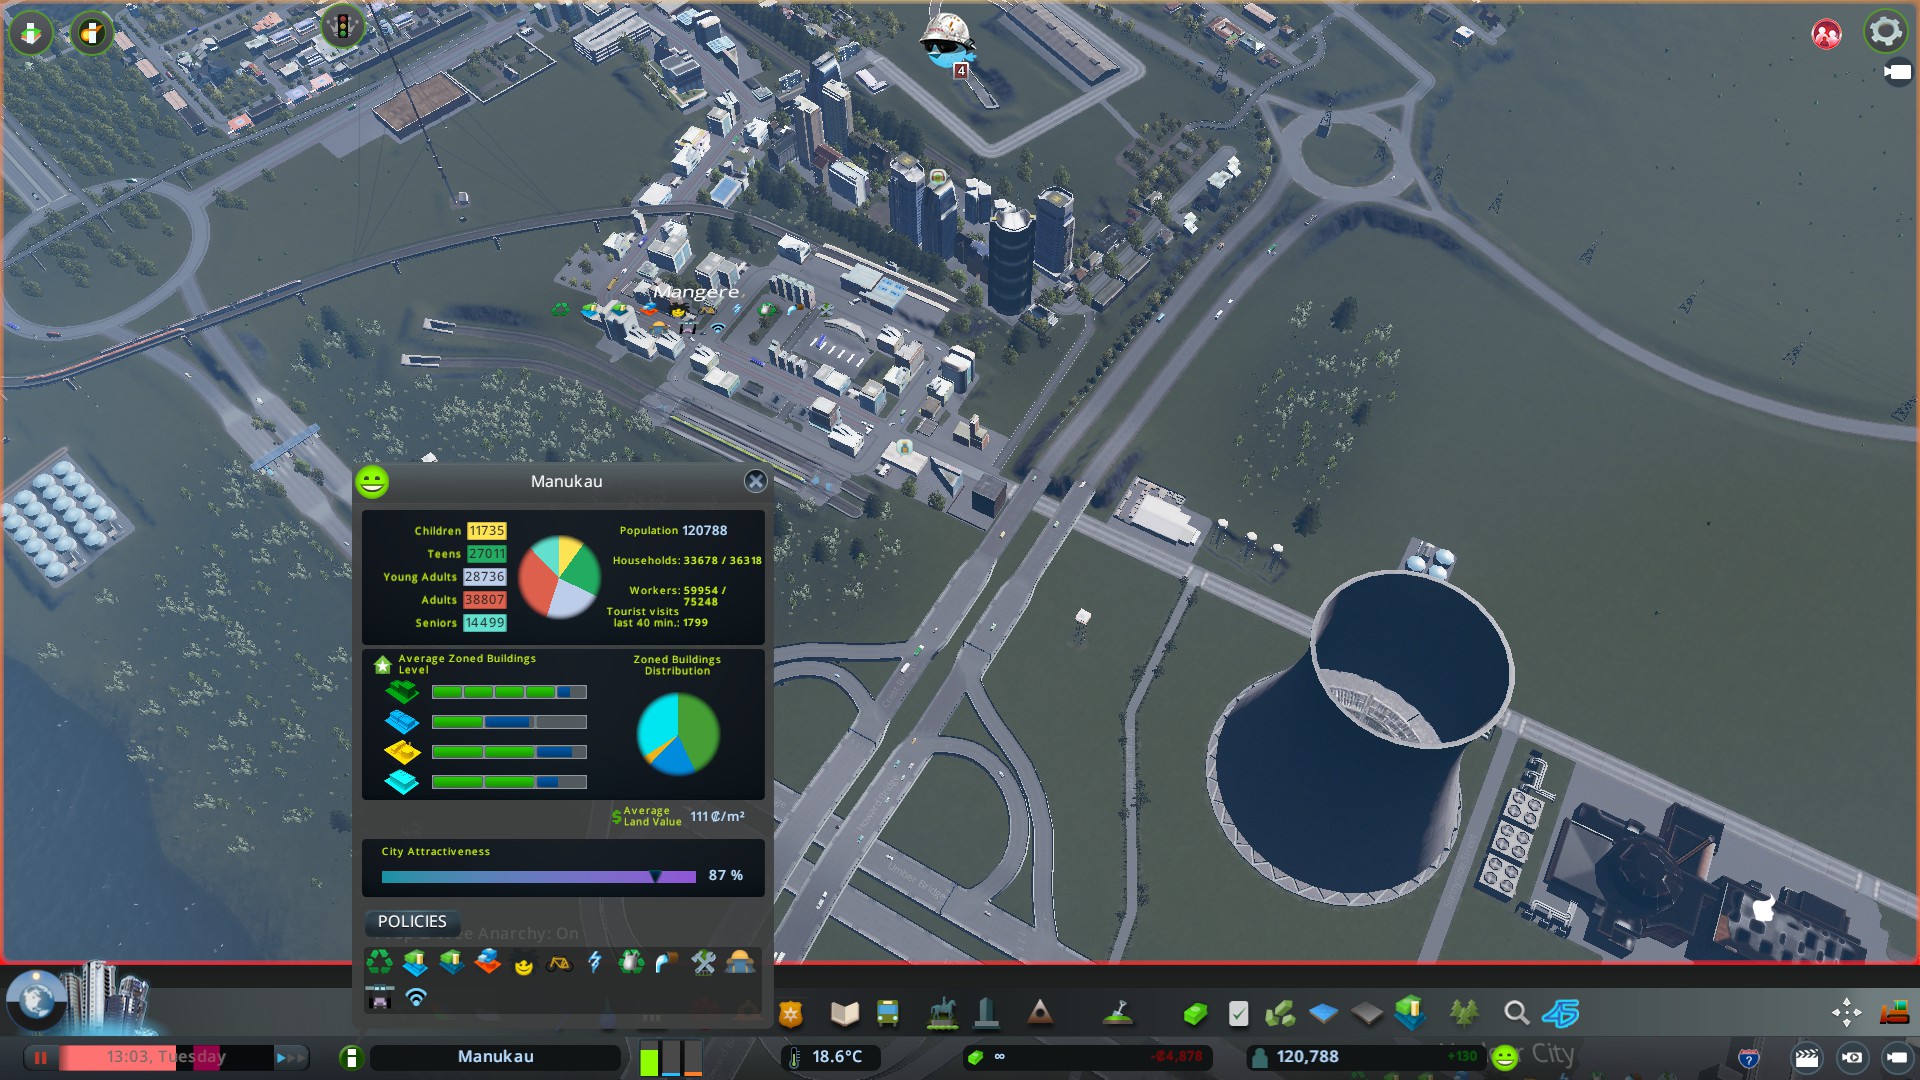
When your City surges from 109,000 to 133,000 in two days of game play (basically the equivalent of Auckland’s growth from 2010 until 2019 (today)) you need to have your wits about you to keep the City functioning and flowing.
How do you do this? Using the Cities Skylines equivalent of BIG DATA – and lots of pictures:
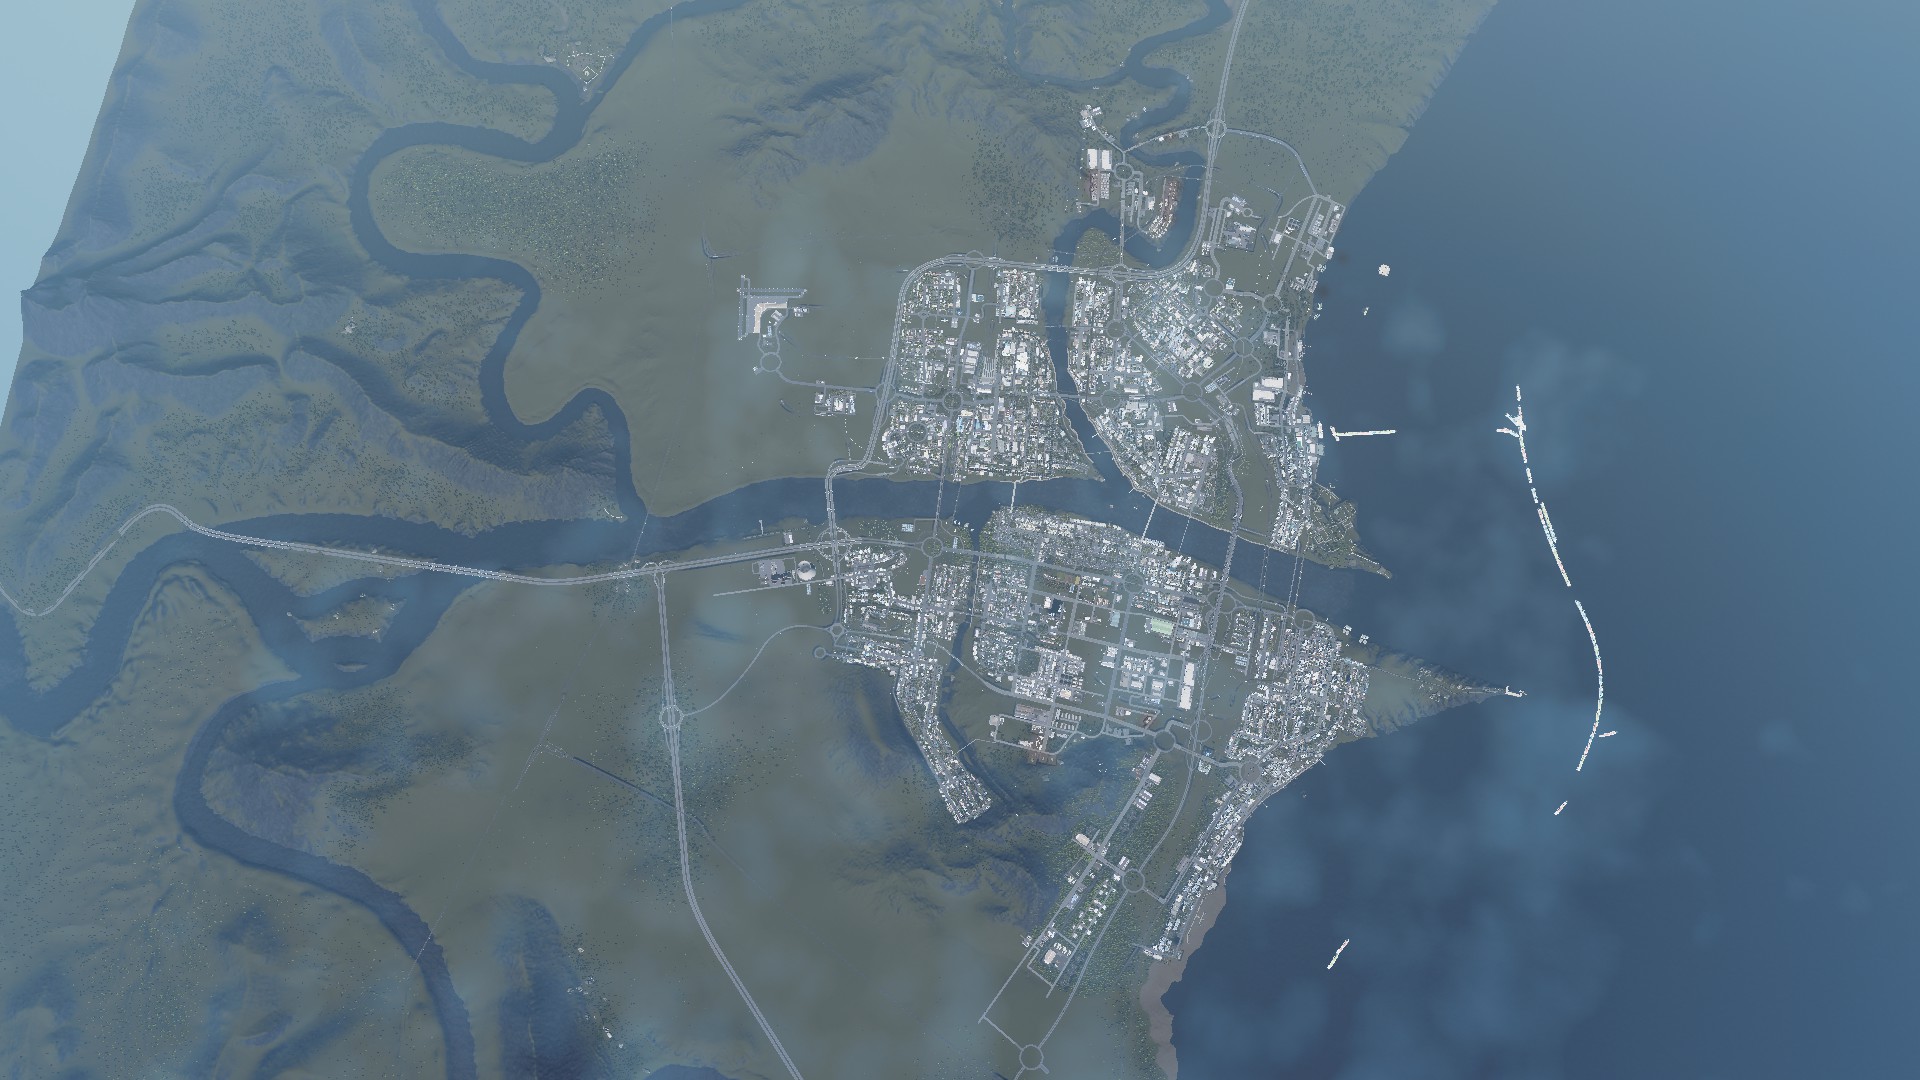


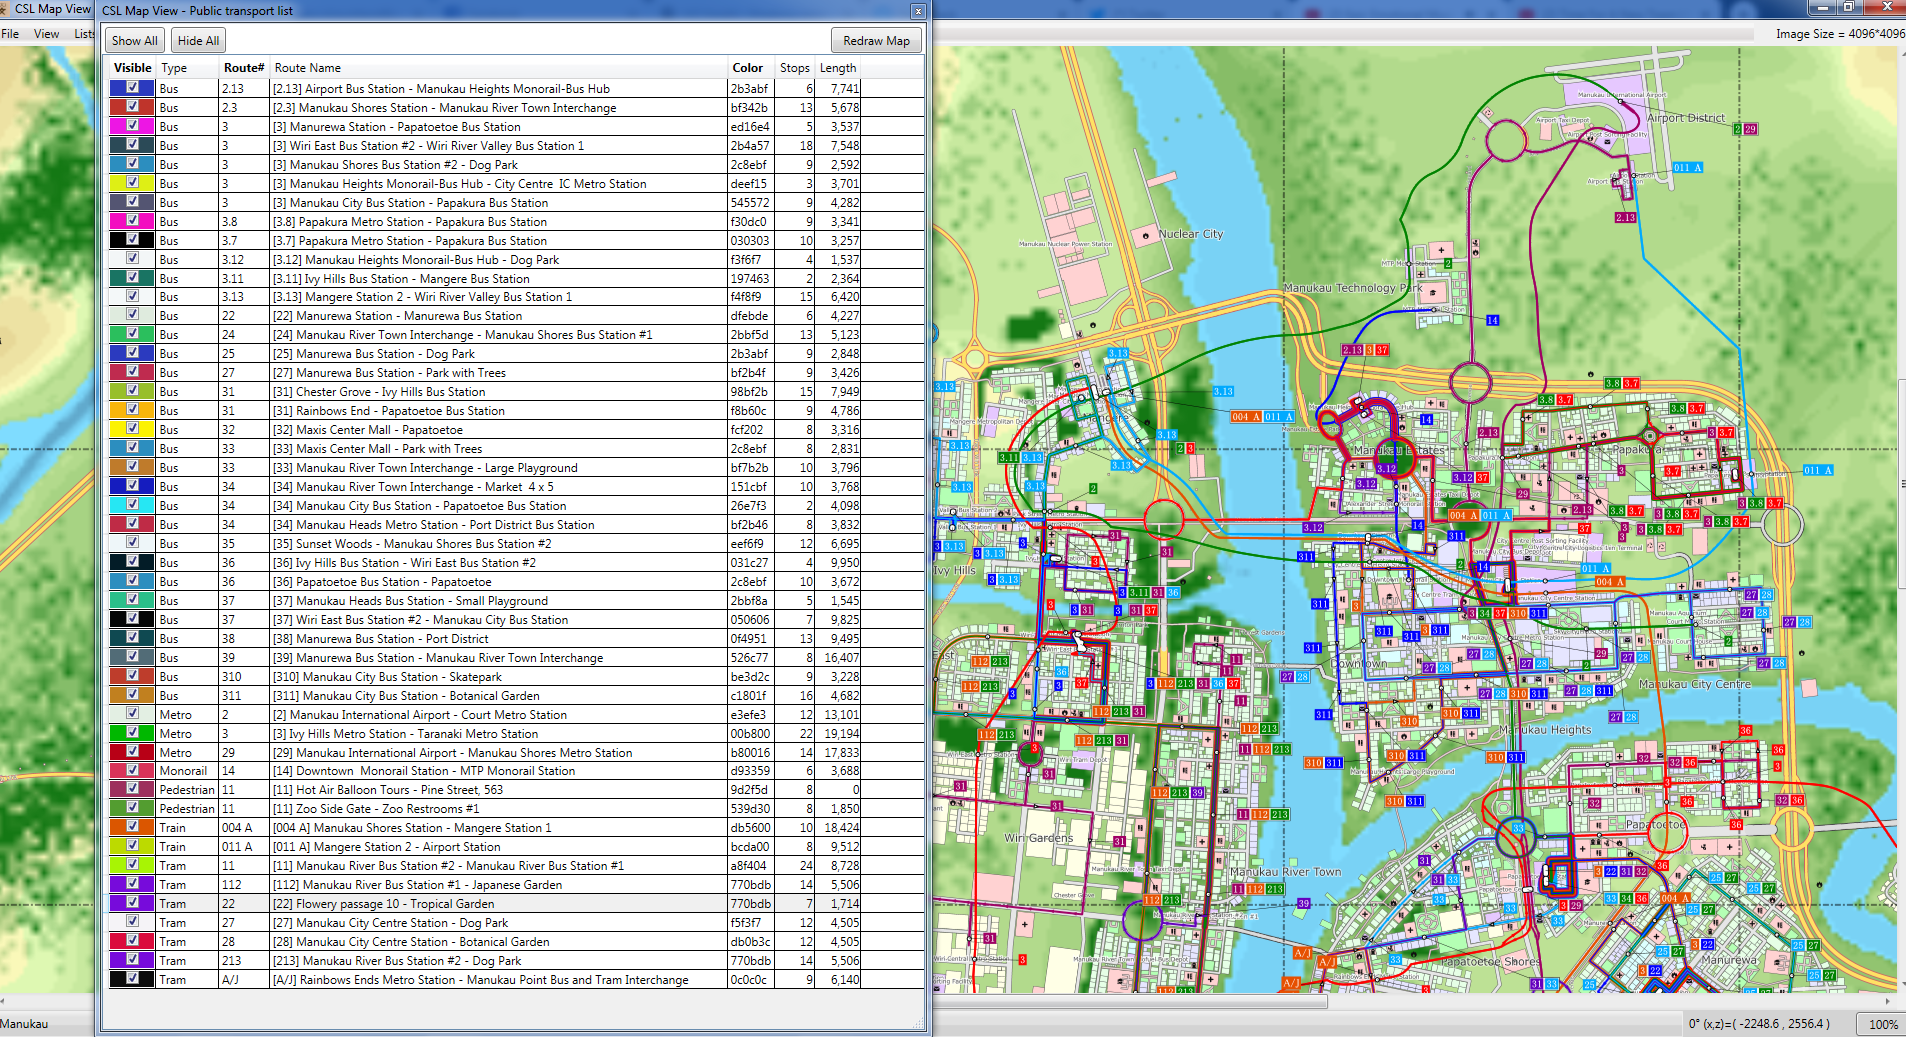


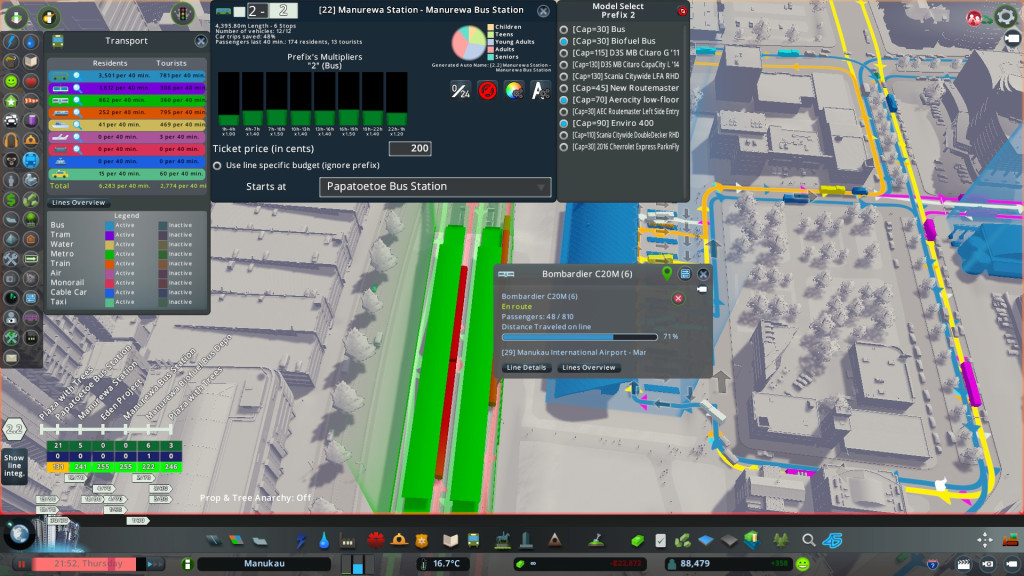

From aerial photos, to transit line maps, to congestion maps, demographics and even the terrain I can access it all at the click of a button.
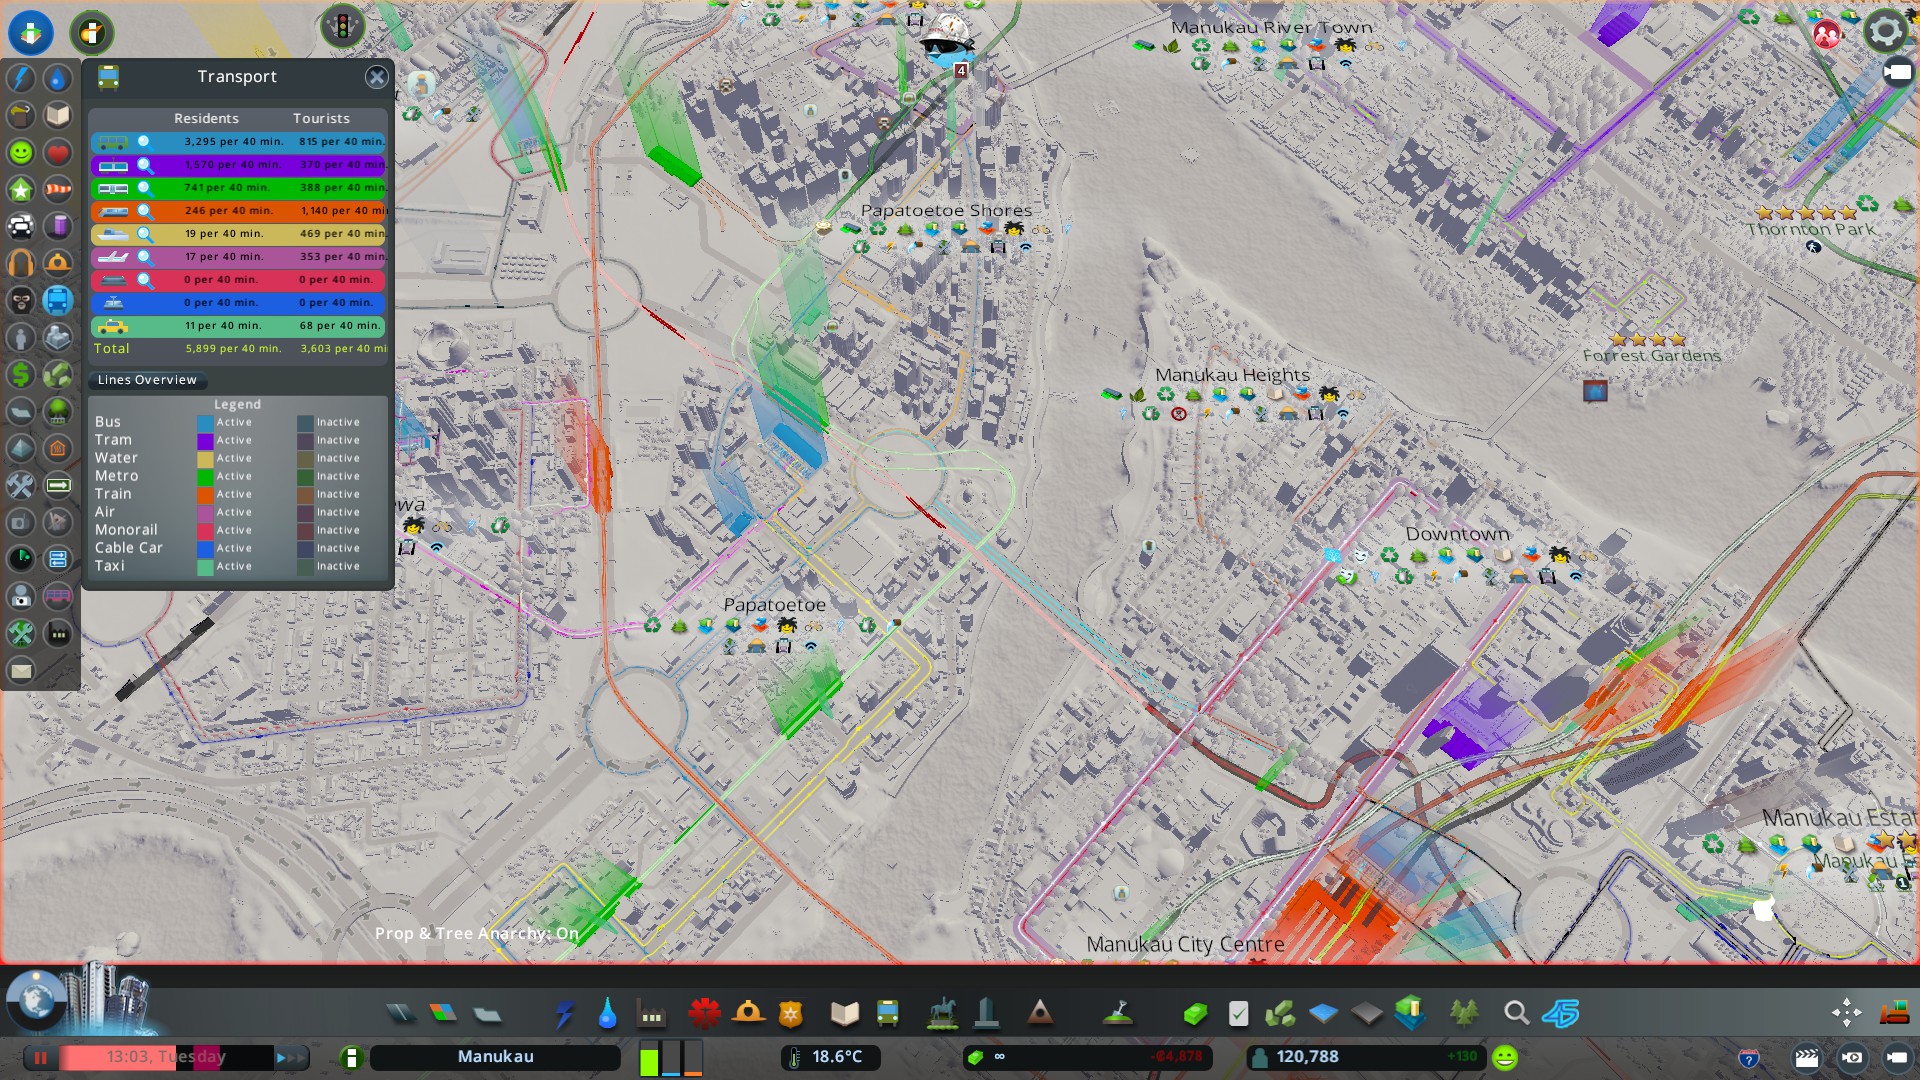
These photos and Big Data sets is what influences how I plan the City ahead for future development while also handling problems like traffic congestion and transit use overload (too many passengers for a particular mode on a particular Line). Essentially I become a Geographer, Transport Engineer, Planner, Urban Designer and Demographer all in one go in order to keep the City functioning.
Failure to do so means mass abandonment and the City going nearly bankrupt as Biffa tried to avoid with this disaster:
Big Data and aerial photos, your City builder friend.
And yes the traffic is flowing well as it stays above 70% with the main two congestion points (City Centre and Cruise Terminal) going through their “Business Cases” for the upcoming upgrades.
Those sodding Business Cases 😛
